4 Simple Tips for Improving Core Web Vitals
OK, we get it. You’re scared.
You promised someone you would improve their site’s speed, and now you’re trying to figure out how you’re actually going to do that.
You’re not an imposter. You’re an optimist. And optimists know how to figure shit out.
We put together 4 simple tips for you, with a focus on site speed optimizations on the Core Web Vitals:
1 - Use Chrome Dev Tools to Test changes
If you (or your dev friends) are making code changes in a test environment (e.g. staging), and it's password protected, you will not be able to run the page through pagespeed insights.
But, you can test with Lighthouse in Chrome Dev Tools, which is basically the same thing.
Right click in Chrome (Two finger click on a Mac)
Click "Inspect"
Click "Lighthouse" in the top nav bar
Click the big button to "generate report"
2 - Test with lab data. Not field data.
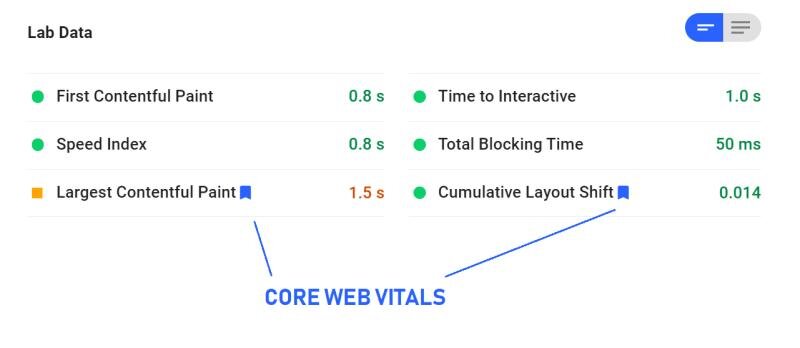
As you’re testing improvements in the staging environment, you should be looking at the lab data (not field data).
When you look at lab data, you’ll notice there are 3 core web vitals (CLS, LCP, and FID) , but only 2 of them show up under lab. So, where is FID?
Well, FID can only be measured in the field. So, take this advice from web.dev:
"To help predict FID in the lab, we recommend Total Blocking Time (TBT). They measure different things, but improvements in TBT usually correspond to improvements in FID."
And if you’re wondering what the field values are for, those are taken from real Chrome users out in the wild using Google’s CrUX data.
3 - Figure out which page element is your LCP
If you’ve made it this far, you’re definitely not an imposter, so we threw in a more advanced tip for you :)
Want to know how to find the LCP (Largest Contentful Paint) on a page?
You can do it in Chrome Dev Tools:
Open dev tools. (Right click, and "inspect")
Click "Performance"
Click reload button to record page load
Wait for about 10 seconds, stop the recording (if it hasn’t already stopped automatically)
Find the "timings" section in the profile and click the little "LCP" flag (see my screenshot)
Chrome will then highlight the element on the left.
4 - Confirm that your site speed is actually slow
So, Google tells you your site is “slow”. Well, here’s a dirty little secret- it’s probably better than average, because the relative "slowness" is very much dependent on the vertical, and the “slow” label can be a bit deceiving.
As an example, we ran scores on ten gift-related ecommerce SERPs (1st page only) using our site speed tool.
Guess what. Only 4% of sites were fast!
In other words, 96% of the pages measured slow (<50) 😳
Want to do a similar analysis in your vertical?
Use our site speed comparison tool.


